


Limitless Potential of Data Ops and AI
Introduction

Traditional DataOps challenges
Inspironlabs, AI-Led DataOps Framework
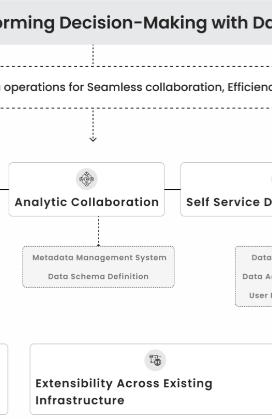
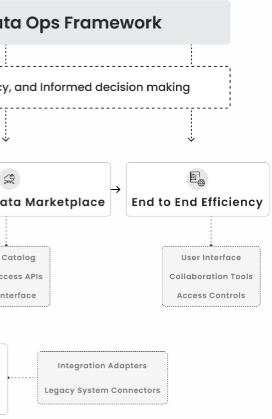
Our Services enabling you to take informed decisions at early stages
We efficiently manage testing environments with our AI enabled tools, enabling create, duplicate, and isolate sandbox environments for testing and validation. This ensure production environment stability during development and testing.
What makes us more reliable in DataOPs
Limitless Potential of Data Ops & AI with InspironLabs!
Author’s Profile

Kiran Pawar • 31 July, 2025
Zero-Code Instrumentation in Spring Boot Application: OpenTelemetry, Tempo and Grafana Setup
Introduction
In today’s complex microservices landscape, understanding how requests flow through your distributed system has become more critical than ever. When an API call traverses multiple services, it can be challenging to identify performance bottlenecks, track down errors, or optimize system performance. This complexity often leads to longer debugging sessions and makes it difficult to maintain optimal application performance.
OpenTelemetry Spring Boot integration emerges as a powerful solution to this challenge, providing comprehensive observability for Spring Boot applications through distributed tracing. In this guide, we’ll walk through implementing zero-code instrumentation for Spring Boot applications using OpenTelemetry, with Tempo tracing as our trace storage backend and Grafana Tempo integration for visualization.
Understanding Distributed Tracing
What Are Traces?
Think of a trace as a detailed story of a single request’s journey through your system. It captures the complete lifecycle of an API call, documenting every service interaction, operation performed, and the time spent at each step.
A trace consists of multiple spans, where each span represents an individual operation or unit of work within a service. When combined, these spans create a comprehensive picture of how a request was processed across your distributed architecture.
Distributed tracing tools specifically refer to traces that span multiple microservices or system components, providing invaluable insights into cross-service interactions and helping identify performance bottlenecks in complex architectures.

Implementing Zero-Code Instrumentation for Spring Boot
Step 1: Download OpenTelemetry Java Agent
The first step involves downloading the OpenTelemetry Java agent, which provides automatic instrumentation without requiring code changes—ideal for instrumenting Spring Boot applications in a zero-code way.
- Download the OpenTelemetry agent for Java from the official releases page
- Place the downloaded JAR file in your preferred directory within your code repository
- Ensure compatibility by checking the supported libraries and frameworks documentation
Step 2: Configuration Setup
You have two primary options for configuring OpenTelemetry for your Spring Boot observability setup:
Option 1: Properties File Configuration
Create a config.properties file in your repository with the following comprehensive configuration:
# =====================================
# SERVICE CONFIGURATION
# =====================================
otel.service.name=YOUR_SERVICE_NAME
otel.service.version=2.0.0
# =====================================
# RESOURCE ATTRIBUTES
# =====================================
otel.resource.attributes=service.name=YOUR_SERVICE_NAME,service.version=2.0.0,deployment.environment=$ENVIRONMENT
# =====================================
# EXPORTERS CONFIGURATION
# =====================================
# Enable only traces, disable metrics and logs to reduce noise
otel.traces.exporter=otlp
otel.metrics.exporter=none
otel.logs.exporter=none
# OTLP Exporter Configuration
otel.exporter.otlp.traces.endpoint=YOUR_OTLP_COLLECTOR_ENDPOINT/v1/traces
otel.exporter.otlp.traces.protocol=http/protobuf
otel.exporter.otlp.traces.compression=gzip
otel.exporter.otlp.traces.timeout=30s
# =====================================
# SAMPLING CONFIGURATION
# =====================================
# Use probabilistic sampling – 1.0 means 100% sampling
otel.traces.sampler=parentbased_traceidratio
otel.traces.sampler.arg=1.0
# =====================================
# INSTRUMENTATION CONFIGURATION
# =====================================
otel.instrumentation.http.enabled=true
otel.instrumentation.spring-web.enabled=true
otel.instrumentation.spring-webmvc.enabled=true
otel.instrumentation.jdbc.enabled=true
otel.instrumentation.mongo.enabled=true
# =====================================
# SPAN PROCESSING CONFIGURATION
# =====================================
otel.bsp.schedule.delay=500ms
otel.bsp.max.queue.size=2048
otel.bsp.max.export.batch.size=512
otel.bsp.export.timeout=30s
To know more about system attributes and environment variables, you can check here.
Option 2: Kubernetes ConfigMap
For Kubernetes observability deployments, create a ConfigMap:
kubectl create configmap otel-config –from-file=config.properties -n YOUR_NAMESPACE
Then mount it in your deployment:
volumeMounts:
– name: config-volume
mountPath: /app/target/config.properties
subPath: config.properties
volumes:
– name: config-volume
configMap:
name: otel-config
Step 3: Application Integration
Integrate the OpenTelemetry agent with your Spring Boot application by modifying your startup command for full OpenTelemetry Spring Boot tracing:
java -javaagent:/app/target/opentelemetry-javaagent.jar \
-Dotel.resource.attributes=env.name=$ENVIRONMENT \
-Dotel.javaagent.configuration-file=/app/target/config.properties \
-jar your-application.jar
For containerized applications, update your Dockerfile:
COPY build/libs/*.jar /app/target/
COPY config/otel/opentelemetry-javaagent.jar /app/target/
COPY config/otel/config.properties /app/target/
ENV ENVIRONMENT=”production”
CMD java -javaagent:/app/target/opentelemetry-javaagent.jar \
-Dotel.resource.attributes=env.name=$ENVIRONMENT \
-Dotel.javaagent.configuration-file=/app/target/config.properties \
-jar your-application.jar
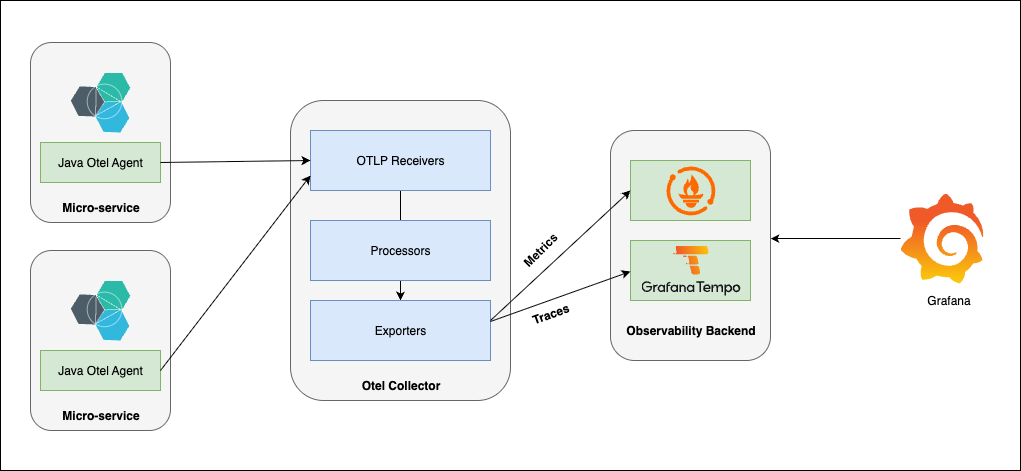
Setting Up OpenTelemetry Collector
The OpenTelemetry Collector acts as a central hub for receiving, processing, and exporting telemetry data in your microservices monitoring tools stack.
Collector DaemonSet Configuration
apiVersion: apps/v1
kind: DaemonSet
metadata:
name: otel-collector
namespace: monitoring
spec:
selector:
matchLabels:
app: otel-collector
template:
metadata:
labels:
app: otel-collector
spec:
containers:
– name: otel-collector
image: otel/opentelemetry-collector:latest
args: [“–config=/conf/otel-collector-config.yaml”]
ports:
– containerPort: 8889 # Prometheus scrape
– containerPort: 4317 # OTLP gRPC
– containerPort: 4318 # OTLP HTTP
volumeMounts:
– name: otel-config-vol
mountPath: /conf
volumes:
– name: otel-config-vol
configMap:
name: otel-collector-config
Collector Configuration
apiVersion: v1
kind: ConfigMap
metadata:
name: otel-collector-config
namespace: monitoring
data:
otel-collector-config.yaml: |
receivers:
otlp:
protocols:
grpc:
endpoint: 0.0.0.0:4317
http:
endpoint: 0.0.0.0:4318
processors:
batch:
timeout: 1s
send_batch_size: 1024
memory_limiter:
limit_mib: 512
check_interval: “5s”
filter/apicalls:
error_mode: ignore
traces:
span:
– ‘attributes[“server.address”] == “otel-collector.monitoring.svc.cluster.local”‘
exporters:
otlp/tempo:
endpoint: tempo:4317
tls:
insecure: true
service:
pipelines:
traces:
receivers: [otlp]
processors: [memory_limiter, filter/apicalls, batch]
exporters: [otlp/tempo]
The collector configuration consists of four main components:
- Receivers: Collect telemetry data from various sources (OTLP, Prometheus, Zipkin)
- Processors: Transform and filter telemetry data (batching, memory limiting, filtering)
- Exporters: Send processed data to storage backends (Tempo, Jaeger, Prometheus)
- Service: Define processing pipelines connecting receivers, processors, and exporters
Installing Grafana and Tempo
Setup Using Helm Charts
First, add the Grafana Helm repository:
helm repo add grafana https://grafana.github.io/helm-charts
helm repo update
Install Grafana
helm install grafana grafana/grafana –namespace monitoring –create-namespace
Retrieve the admin password:
kubectl get secret –namespace monitoring grafana -o jsonpath=”{.data.admin-password}” | base64 –decode
Install Tempo
Tempo is optimized for distributed tracing tools and pairs seamlessly with Grafana for observability.
Create a tempo-values.yaml file:
persistence:
enabled: true
size: 10Gi
storageClassName: your-storage-class
tempo:
receivers:
otlp:
protocols:
grpc:
endpoint: 0.0.0.0:4317
http:
endpoint: 0.0.0.0:4318
resources:
limits:
cpu: 1000m
memory: 1Gi
requests:
cpu: 300m
memory: 512Mi
server:
http_listen_port: 3200
storage:
trace:
backend: local
local:
path: /var/tempo/traces
Install Tempo:
helm install tempo grafana/tempo –namespace monitoring -f tempo-values.yaml
Configuring Grafana Data Source
To visualize traces in Grafana and enable effective monitoring of microservices, follow these steps:
- Login to Grafana using the admin credentials
- Navigate to Data Sources: Go to Connections → Add New Connection
- Add Tempo Data Source: Search for “Tempo” and click “Add New Datasource”
- Configure Connection: Enter the Tempo service URL (typically http://tempo:3200)
- Save and Test: Verify the connection is working properly
Exploring Traces in Grafana
Once everything is configured:
This setup provides a powerful observability platform for Spring Boot microservices where you can analyze request flows, identify performance bottlenecks, and troubleshoot issues using Grafana Tempo integration.
- Navigate to Explore: Use Grafana’s Explore feature
- Select Tempo Data Source: Choose your configured Tempo data source
- Search Traces: Use the Search query type with filters such as:
a.Service Name
b.Span Name
c.Status (success/error)
d.Duration ranges
e.Custom attributes
This setup provides a powerful observability platform where you can analyze request flows, identify performance bottlenecks, and troubleshoot issues across your microservices architecture
Summary
This comprehensive guide demonstrated how to implement zero-code instrumentation for Spring Boot applications using OpenTelemetry. We covered the essential components needed for a complete observability stack:
- OpenTelemetry Java Agent: Provides automatic instrumentation without code modifications
- OpenTelemetry Collector: Acts as a central processing hub for telemetry data
- Tempo: Serves as a scalable trace storage backend
- Grafana: Offers powerful visualization and analysis capabilities
The zero-code instrumentation approach significantly reduces implementation overhead while providing comprehensive distributed tracing capabilities. The configuration-driven setup allows for easy customization and deployment across different environments.
Conclusion
Implementing distributed tracing with OpenTelemetry, Tempo, and Grafana creates a robust Spring Boot observability foundation for microservices architectures. This setup enables development teams to quickly identify performance issues, understand service dependencies, and optimize application performance with minimal code changes.
The zero-code instrumentation approach makes observability accessible to teams without requiring extensive modifications to existing applications. As your system grows in complexity, this OpenTelemetry Spring Boot stack will prove invaluable for maintaining system reliability and performance.
By following this implementation guide, you’ll have a production-ready observability platform that scales with your microservices architecture and provides the insights needed to maintain optimal system performance.
Ready to enhance your observability strategy? Contact us today or explore our solutions at inspironlabs.com to see how we can help you build scalable, high-performance microservices.


